AP Biology Graphs and Data: Read What the Figure Is Actually Saying
Many AP Bio misses happen after the graph, not before it. Learn how to read axes, controls, comparisons, and claims without bluffing the biology.
Read it to name the pattern, then practice while it is still fresh.
Prepared by Askiras editorial team. These guides stay short on purpose: one pattern, one worked example, one clear next step into practice. How we build guides.
Uses public AP course and exam context; does not reproduce protected College Board prompts.
College Board AP context, Askiras independence, and no unsupported outcome claims.
How should you read AP Biology graphs?
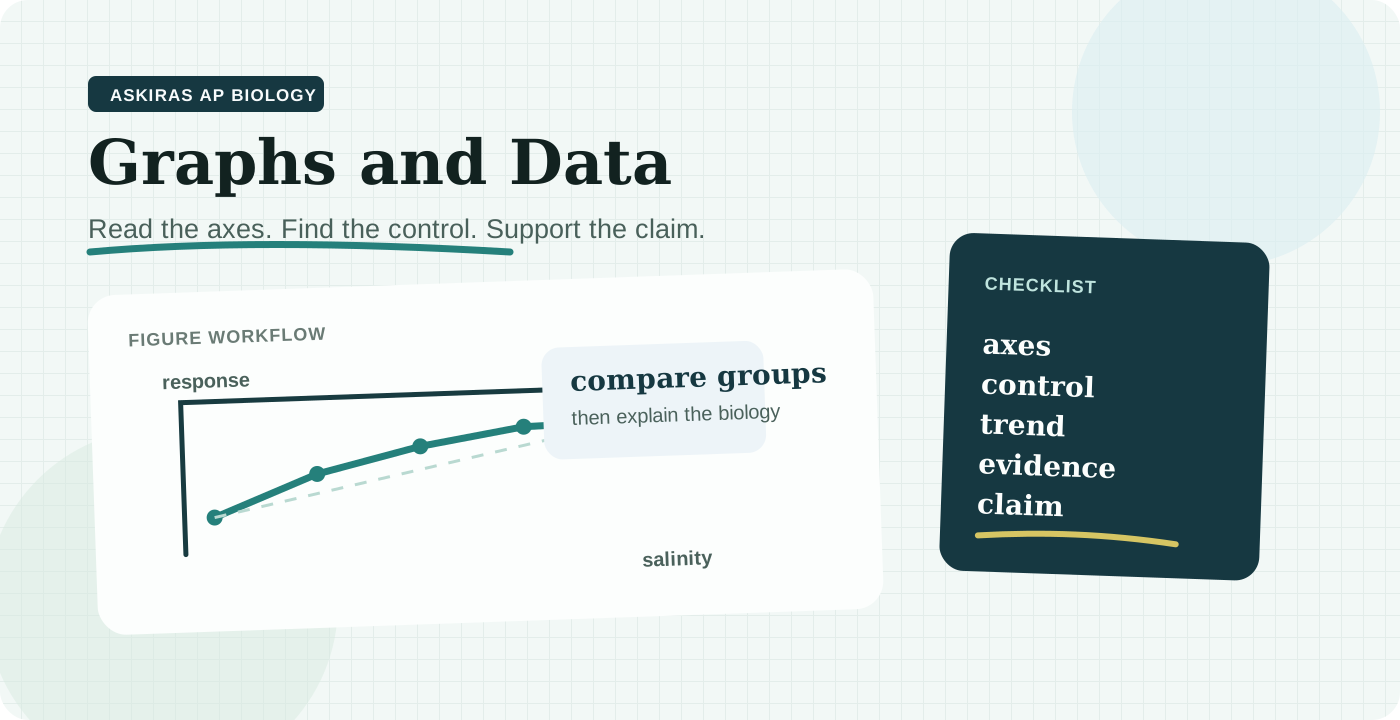
Identify the independent variable, dependent variable, units, comparison groups, and control before writing. Then use only the numbers that prove the claim instead of restating the entire figure.
Many AP Biology questions are really figure-reading questions
Students often say they missed an AP Bio question because they “didn’t know the content.” Sometimes that is true. Very often the real problem is simpler: they did not read the figure carefully enough.
The graph or table was already giving away most of the job. In AP Biology, the figure is often half the answer key.
Start with the structure of the figure
Before you touch the answer choices or start drafting an FRQ response, identify:
- the independent variable
- the dependent variable
- the units
- the groups being compared
- the baseline or control
If you skip that step, you can sound smart and still answer the wrong question.
A worked example
Imagine a table showing the percentage of seeds that germinated after five days under different salinity levels.
| Salinity (mM) | Seeds germinated (%) |
|---|---|
| 0 | 92 |
| 50 | 74 |
| 100 | 31 |
The basic read is:
- salinity is the independent variable
- germination percentage is the dependent variable
- the 0 mM group is the baseline condition
- higher salinity is associated with lower germination
A weak AP Bio answer says: “Salinity affected the plants.”
A stronger answer says: “As salinity increased from 0 mM to 100 mM, germination fell from 92% to 31%, which supports the claim that high salt concentration reduced successful germination.”
That answer works because it does three things:
- names the comparison
- cites the evidence
- states the supported conclusion
The five-step AP Biology figure routine
1. Read the axes or labels literally
Do not answer from the topic alone. Read what the figure is actually measuring.
Questions to ask:
- Is this rate, total amount, percentage, or count?
- Is time on the x-axis?
- Are the categories treatments, genotypes, environments, or species?
Many AP Bio misses start when students see a familiar topic and assume the figure is about one variable when it is really about another.
2. Find the comparison that matters most
You do not need to narrate every point on the graph. You need the comparison that answers the prompt.
Often that means:
- highest versus lowest
- before versus after
- treatment versus control
- one genotype versus another
The figure is not asking you to admire it. It is asking you to decide what changed.
3. Describe the trend before you explain it
A strong order is:
- describe the pattern
- then explain the biology
If you jump straight to explanation, you can end up explaining a trend that the figure does not even show.
For example:
- “Enzyme activity increased from pH 4 to pH 7 and then decreased at pH 9.”
- then: “This supports the idea that the enzyme has an optimal pH near neutral conditions.”
Pattern first. Biology second.
4. Decide how far the data can go
Some figures support a clear comparison. Some only support a limited claim.
Ask:
- does the figure show causation or only association?
- is the sample size or uncertainty shown?
- would a stronger conclusion require another experiment?
Sometimes the best AP Bio answer is more careful, not more confident.
5. Keep the biology tied to the figure
Use content knowledge to explain the pattern you just described. Do not let background knowledge talk you out of what the graph actually says.
Tables, graphs, and models each have different traps
Graphs
Watch for:
- slope versus total amount
- plateau versus continued increase
- overlapping error bars
- negative versus positive relationship
Tables
Watch for:
- forgetting which row is the control
- missing that the values are averages
- ignoring units
Models and diagrams
Watch for:
- arrows that show direction
- relative position of structures
- what is being represented versus what is simplified
AP Biology visuals are often concept-heavy. That makes them easier to overread. Stay close to what is on the page.
The most common graph-reading mistakes
The 60-second mistake checklist
Before you mark a graph question as “content I forgot,” run this tiny checklist on the miss:
| Check | What to write in the margin |
|---|---|
| Variable | What changed, and what was measured? |
| Control | Which group or condition is the baseline? |
| Comparison | Which two groups, points, or time periods answer the prompt? |
| Evidence | What number, trend, or visual detail proves the claim? |
| Limit | Does the figure show cause, association, prediction, or only a pattern? |
If one row is blank, that is probably where the point leaked.
What to do today
Take one AP Bio graph or table you missed and rewrite the answer in this format:
- “The figure shows ___ compared with ___.”
- “The evidence is ___ because ___.”
- “This supports ___, but it does not prove ___ unless the experiment also shows ___.”
That drill is short enough to do before homework, and it trains the exact move that carries into the AP Bio FRQ strategy guide.
Using outside knowledge to defeat the figure
Students sometimes know a general biological fact and pick the answer that matches the fact, even though the figure points elsewhere.
The rule is: use biology to explain the evidence, not to ignore it.
Saying “increase” without naming what increased
“It increased” is weak.
“The mean rate of oxygen production increased” is clear.
Always name the variable that changed.
Confusing correlation with mechanism
A graph may show that two variables move together. That does not automatically prove why.
You can often say:
- the data support an association
- the pattern is consistent with a mechanism
without claiming that the graph alone proves the mechanism.
Forgetting the control
Control groups are not decorative. They are what make the comparison interpretable.
If the question is about treatment effect, the control is usually one of the first things you should mention.
How to use data in AP Biology free responses
When the prompt asks you to justify, predict, or explain using data, a strong mini-structure is:
- make the claim
- cite the evidence
- connect it to biology
Example:
“Plants in the high-nitrogen condition had greater mean leaf area than plants in the control condition, which suggests that nitrogen availability limited growth in the untreated group.”
That is much stronger than: “The treated plants did better because nitrogen helps plants grow.”
The second sentence sounds biologically plausible. The first one is answerable by the figure.
How to train this skill
A useful AP Bio graph set does not need to be long.
Try this:
- one graph where you identify the trend
- one table where you identify the strongest comparison
- one model where you explain what changed
- one short response where you cite the evidence in a sentence
That is enough repetition to make figures feel normal instead of annoying.
What to remember on test day
When a graph or table shows up, slow down just enough to do the scientific job:
- identify the variables
- locate the control
- describe the pattern
- support the claim with evidence
- explain only as far as the evidence lets you go
AP Biology rewards careful reading more than dramatic intuition.
Frequently asked questions
What if I do not know the exact biology in a graph question?
You can still pick up points by reading the axes, control, and comparison correctly. Then use the biology you do know to explain the most supported claim instead of inventing extra detail.
Do error bars matter on AP Biology figures?
Yes. They can affect how confidently you compare groups. If the figure includes error bars, they are part of the evidence and should shape how strong your conclusion sounds.
Should I restate every number from a table or graph?
No. Use the numbers that prove the comparison you are making. A precise comparison is stronger than copying the whole figure into sentences.
Keep going in this exam
Other guides at Askiras
If you are also prepping another exam, these short guides cover the same "name the pattern, then practice" habit.