SAT Desmos Strategy: When to Graph vs. Solve by Hand
SAT Desmos strategy for the digital SAT Math section: when to graph intersections, roots, and models, and when algebra is faster.
Read it to name the pattern, then practice while it is still fresh.
Prepared by Askiras editorial team. These guides stay short on purpose: one pattern, one worked example, one clear next step into practice. How we build guides.
Uses public Digital SAT format and practice-strategy context; does not reproduce protected College Board questions.
College Board Digital SAT context, Askiras independence, and no unsupported outcome claims.
Are you allowed to use Desmos on the SAT?
Yes. The digital SAT Math section includes Desmos as the built-in calculator inside Bluebook. Nothing to install. The useful strategy question is when to graph and when to stay in algebra, since Desmos can waste time on short arithmetic or interpretation questions.
Quick answer: SAT Desmos is allowed, but not always worth using
Yes: on the digital SAT Math section, Bluebook includes an embedded Desmos calculator. Use it when a graph gives the target directly - intersections, zeros, vertices, extrema, shape checks, or model verification. Stay with algebra when the question is one clean solve, percent arithmetic, coefficient meaning, or an exact symbolic form.
Source/update note: Last reviewed June 10, 2026 against College Board’s SAT calculator policy and SAT Math overview. College Board notes that some Math questions are better without a calculator even though calculators are allowed in the section.
What “allowed” really means on test day
Every digital SAT test-taker gets the same Desmos calculator inside Bluebook during the Math section. It opens in the test app the same way the formula reference does - no install, no download, no setup. You can still bring an approved handheld calculator, but Bluebook’s Desmos is available without switching devices.
The harder question is not whether you are allowed to use it. It is when using it actually answers the question and when it quietly costs you time.
Desmos is useful, but it is not a magic button
Students sometimes treat Desmos like a shortcut for everything. That is how it turns from a useful tool into a time leak.
The better rule is simpler:
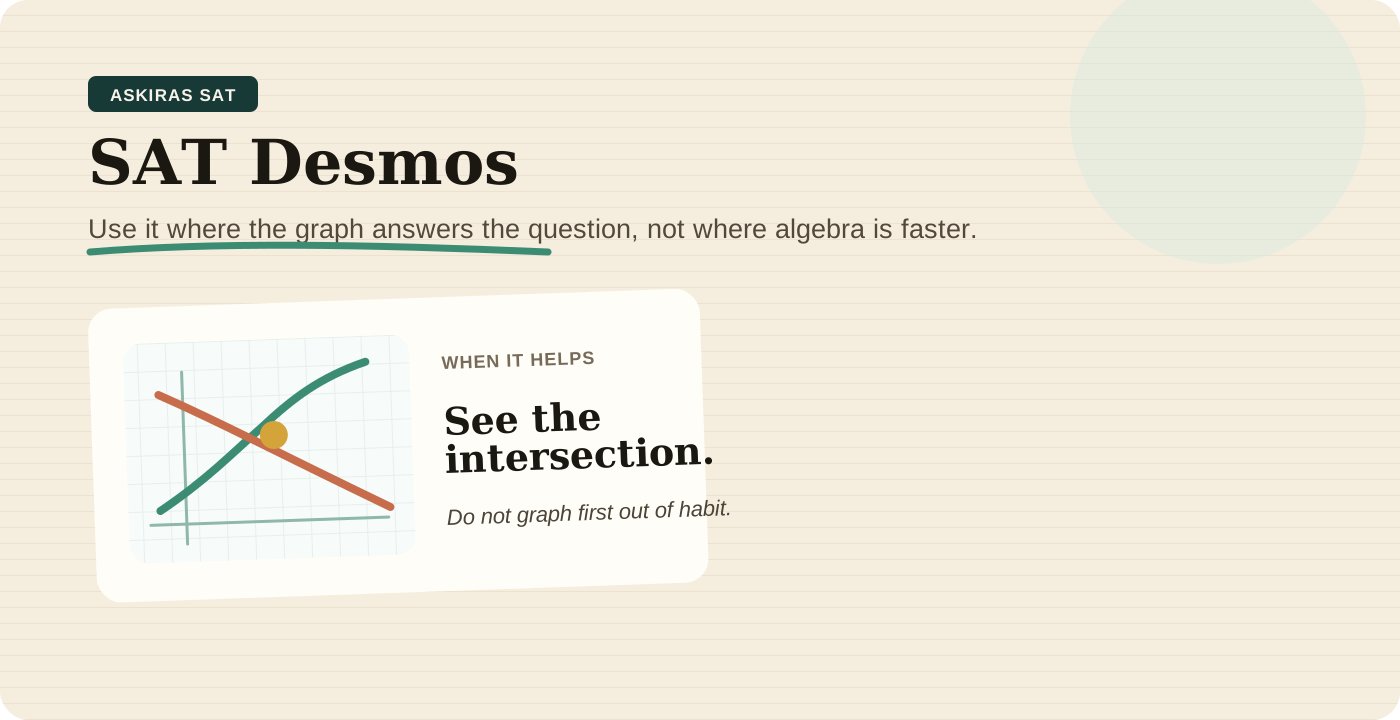
Use Desmos when the graph answers the question faster than your algebra would.
If the question is really asking for an intersection, a zero, a shape, or a quick model check, Desmos can help a lot. If the question is asking for one clean algebra move, it is usually better to stay out of the calculator.
Fast example first
Suppose the SAT gives you:
The graphs of
y = x^2 - 5x + 6andy = xintersect at two points. What is the greater x-coordinate of an intersection point?
You can do this algebraically:
- set
x^2 - 5x + 6 = x - get
x^2 - 6x + 6 = 0 - solve the quadratic
That works. But Desmos may be faster here:
- graph both expressions
- see the two intersections
- read the larger x-value
That is a good Desmos use case because the graph is the answer.
When Desmos is worth using
1. Intersection questions
If the answer comes from where two graphs meet, Desmos is often strong.
Typical examples:
- line and parabola
- two systems in context
- where two models produce the same output
The key is that the graph gives the answer directly.
2. Zeroes and roots
When the question wants x-values where an expression equals zero, graphing can save time, especially if factoring is awkward.
This helps most when:
- the algebra is messy
- the answer choices are numerical
- you mainly need to identify the correct root, not prove a symbolic form
3. Function shape checks
Some SAT questions are really asking:
- where is the vertex
- which graph fits the equation
- how did the graph shift
Desmos is useful here because it lets you stop guessing and start seeing.
4. Model verification
You build an equation from a word problem and want to make sure it behaves the way the story says it should.
That is another good use. Desmos can show whether your model is rising, falling, crossing, or curving the way the question suggests.
When Desmos usually slows you down
1. Basic linear solving
If the question is just:
- solve for x
- isolate a variable
- simplify an expression
opening Desmos is usually slower than doing the math.
2. Percent and ratio questions
Most percent-change questions are about setting up the right arithmetic. Graphing them often adds a useless extra step.
3. Questions asking for meaning, not value
If the SAT asks what a coefficient represents or what a constant means in context, Desmos cannot do the thinking for you.
That is a reading question inside a math wrapper — the interpretation pattern walked through in the SAT math patterns guide.
4. Questions where the exact form matters
Sometimes Desmos shows an approximate decimal, but the test really wants:
- an exact fraction
- a symbolic expression
- a parameter relationship
If the graph only gets you close, it may not be enough.
The three Desmos mistakes that keep costing points
Graphing before understanding the ask
This is the big one.
Students see a calculator and jump straight into plotting. But the first question should always be:
What is this problem actually asking me for?
If the answer is not visible from a graph, Desmos may be the wrong tool.
Using a bad window
If the graph looks empty, weird, or incomplete, the window may be hiding the important part.
Always check:
- x-range
- y-range
- whether the features you need are visible
Trusting the graph without interpreting it
Seeing two curves cross is not the whole job. You still need to know:
- which coordinate matters
- whether the question wants the greater or lesser value
- whether the graph confirms the right model
A better Desmos workflow
Use this short routine:
- Read the question and identify the target.
- Ask whether a graph would answer that target directly.
- If yes, graph the minimum needed expressions.
- Fix the window if the graph hides the important feature.
- Translate the graph back into the SAT question.
That last step matters most. Desmos gives you information. You still have to turn it into an answer.
A second example
A company models profit with
p(x) = -2x^2 + 40x - 96, where x is the number of units sold in hundreds. At what value of x is profit greatest?
You can use vertex form or the formula. You can also graph it and spot the vertex.
This is a strong Desmos question because the graph shows the maximum clearly.
But if the SAT then asks what that x-value means in context, you still have to interpret it:
- x is in hundreds
- so
x = 10means1,000units
Desmos helps with the math. It does not replace the reading.
What to practice on purpose
If you want Desmos to help on test day, do not just hope it will. Practice the question types where it actually earns its place:
- intersections
- roots
- vertex and extrema
- model checks
- graph identification
And practice deciding not to use it on:
- one-step algebra
- percent questions
- interpretation questions
- exact-expression questions
A short drill plan
Take 10 SAT math questions and sort them into two piles:
- graph first
- solve by hand first
Then ask after each one:
- Did Desmos save time?
- Did it reduce error?
- Or did it just make me feel busy?
That is the habit that matters.
Desmos is best when it makes the answer easier to see. If it is not doing that, put it away.
If this guide is your SAT Math calculator plan, pair it with SAT hard math question types for the non-calculator decision work and SAT linear equation word problems for the algebra questions where graphing is optional, not automatic.
Frequently asked questions
Are you allowed to use Desmos on the SAT?
Yes. The digital SAT Math section includes Desmos as a built-in graphing calculator in Bluebook. You don't need to download or install anything; it opens inside the test app.
Should I use Desmos on every SAT math question?
No. Desmos is best when the graph answers the question directly. On short algebra or arithmetic, it often slows you down.
What kinds of SAT questions are best for Desmos?
Questions about intersections, zeros, graph shape, and model checking are usually the best fit.
Can Desmos hurt my SAT math timing?
Yes. If you graph too early, use a bad window, or rely on it for simple work, it can waste time instead of saving it.
Keep going in this exam
Other guides at Askiras
If you are also prepping another exam, these short guides cover the same "name the pattern, then practice" habit.